MICROWAVE DATA
This section contains T/2-spaced (symbol spacing T) FIR digital microwave
radio channels extracted from processing of field measurements of received
signals, courteousy of
Applied Signal Technology,
Sunnyvale, CA. The channel models may be obtained from the
SPIB database at Rice University.
Channels 1-5 are precisely those channels described/used in
- C.R. Johnson, Jr. et.al., "On Fractionally-Spaced Equalizer Design
for Digital Microwave Radio Channels,"
Proc. of the 29th Asilomar Conference, Pacific Grove, CA, Nov
1995.
- J.R. Treichler, I. Fijalkow, C.R. Johnson, Jr.,
"Fractionally Spaced Equalizers: How Long Should They Really Be?"
IEEE Signal Processing Magazine,
Vol. 13, No. 3, pp. 65-81, May 1996
Moreover, shortened versions of these five channels (obtained by decimating the
channel's frequency response) are described/used in
- T.J. Endres, S.D. Halford, C.R. Johnson, Jr., G.B. Giannakis,
"Blind Adaptive Channel Equalization Using Fractionally-Spaced
Receivers:
A Comparison Study,"
Proc. Conf. on Info. Sciences and Systems, Princeton, NJ, March 1996
- G.B. Giannakis and S.D. Halford,
"Blind Fractionally-Spaced Equalization of Noisy FIR Channels:
Direct and Adaptive Solutions,"
IEEE Transactions on Signal Processing,
In Press
Help keep this citation database complete by submitting via e-mail your
references for the above lists when you use these microwave channels:
johnson@ee.cornell.edu
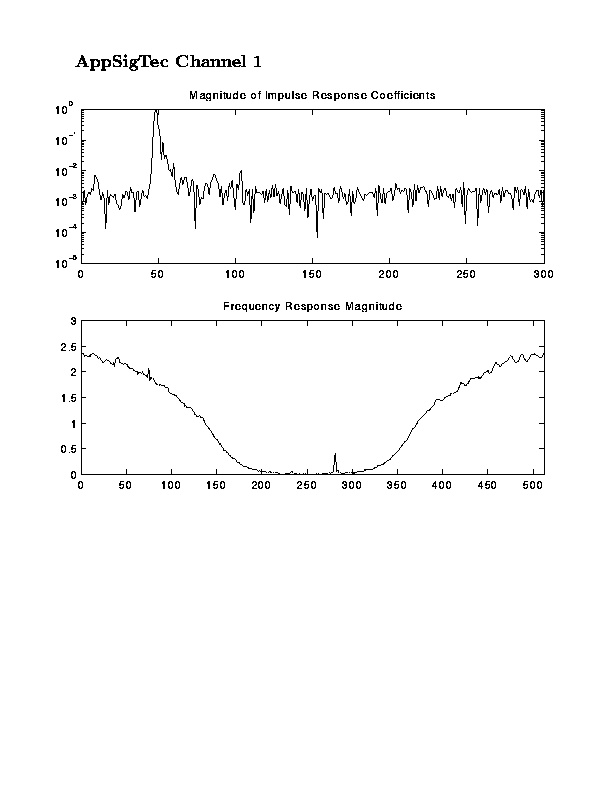
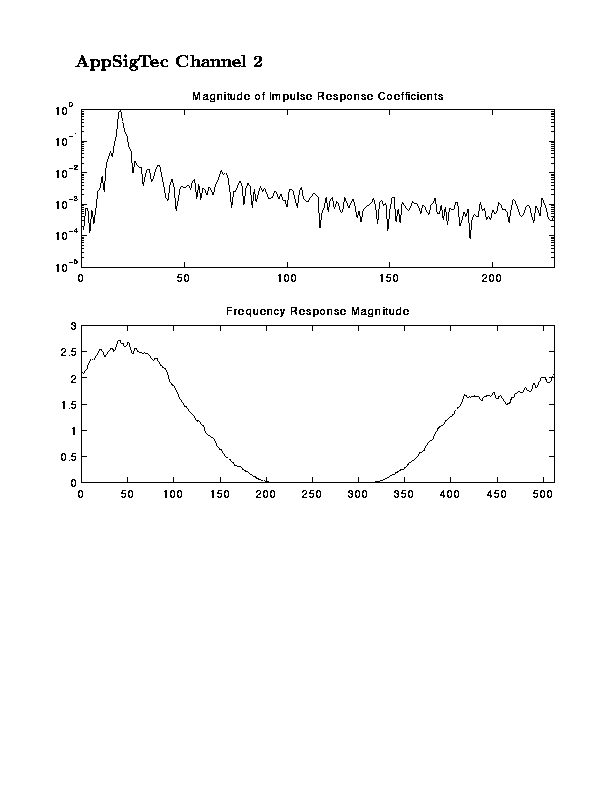
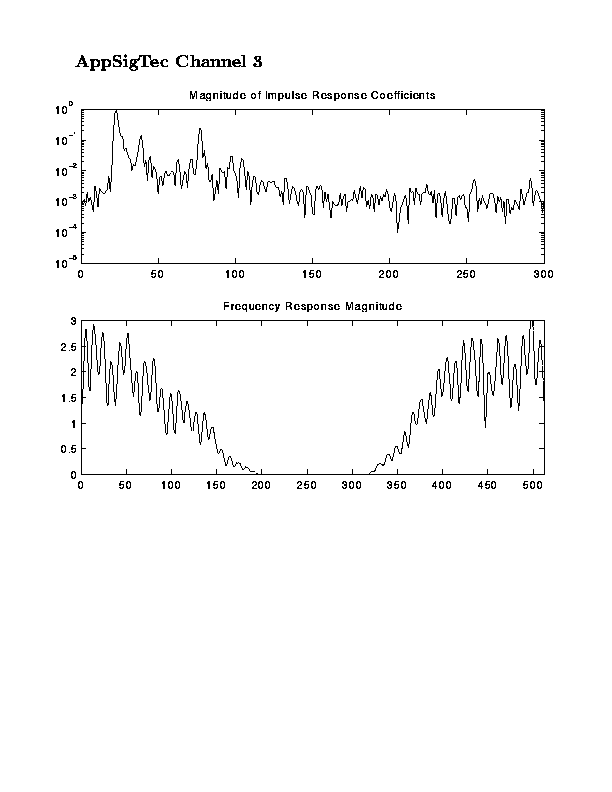
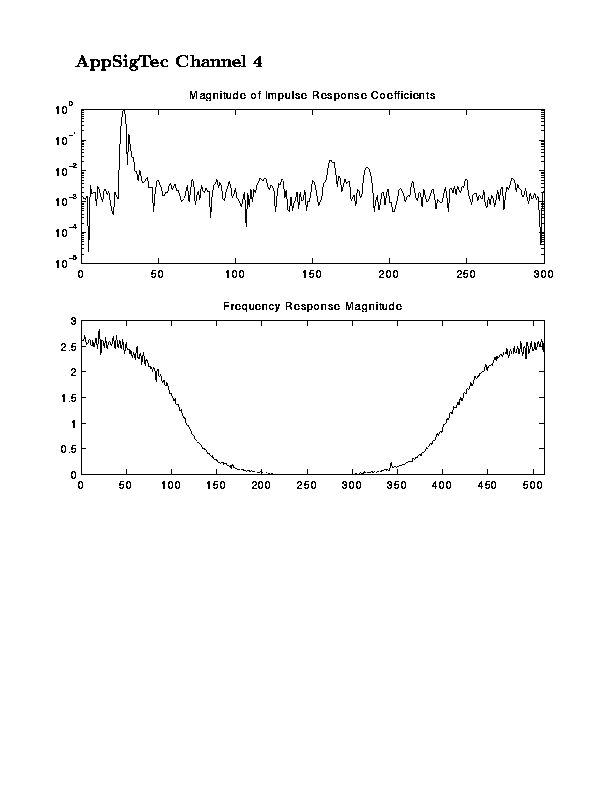
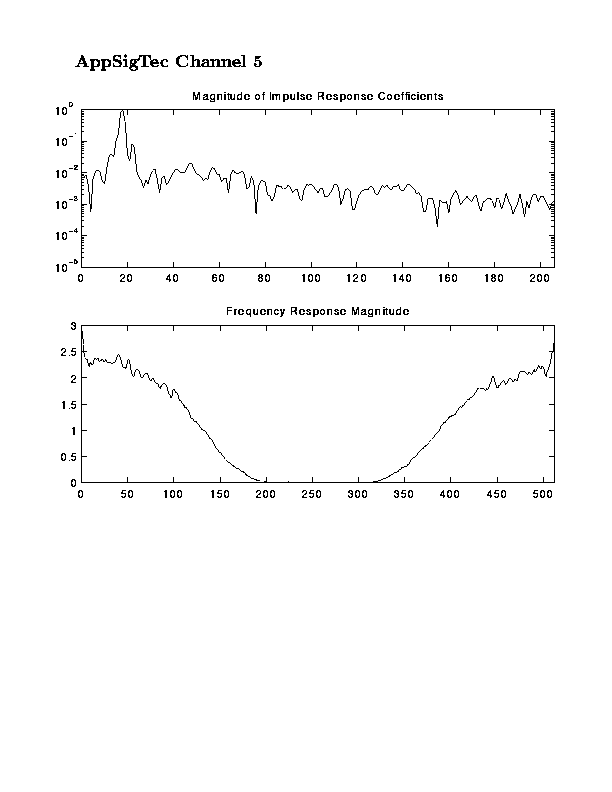
The Matlab code below was used to generate the following plots.
load chan1
chan=C; clear C;
Lc=length(chan);
chan=chan/max(abs(chan));  %Normalize for unity maximum tap
subplot(211), semilogy(abs(chan))
axis([0 Lc 1e-5 1e0])
title('Magnitude of Impulse Response Coefficients')
subplot(212),
[H,W]=freqz(chan,1,512,'whole');
plot(abs(H))
axis([0 512 0 3])
title('Frequency Response Magnitude')
Channel Dynamics Plots
