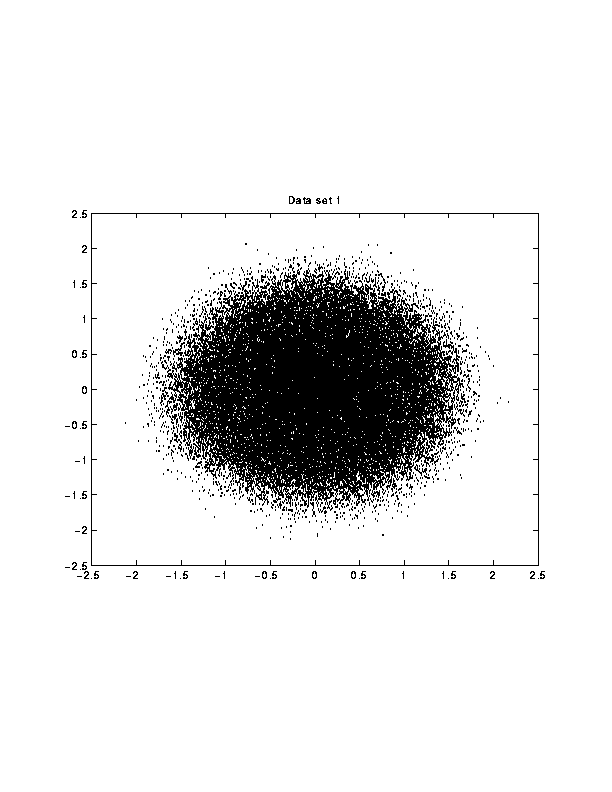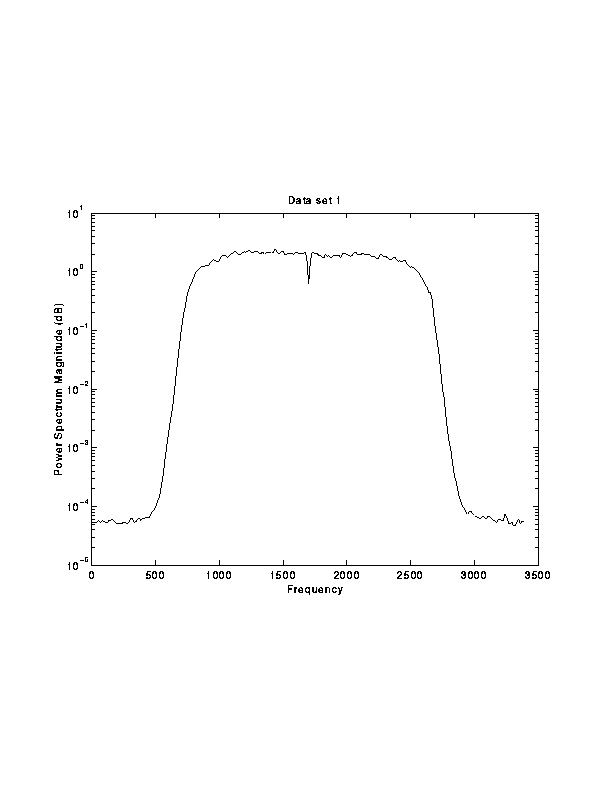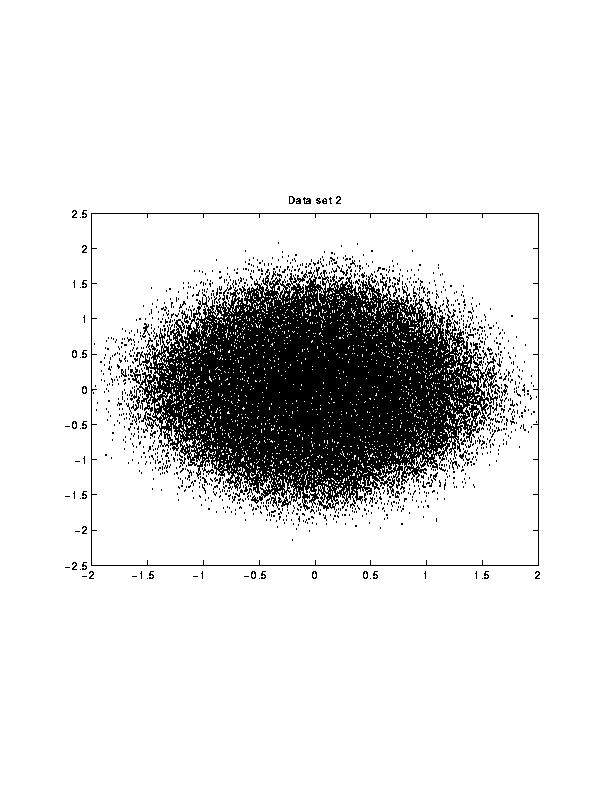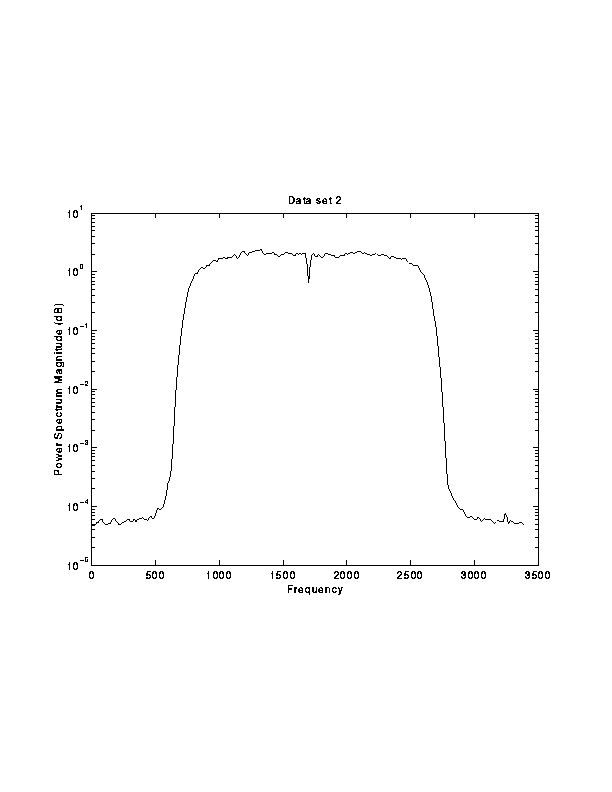
Two (2) snapshots of received cable channel data streams and two (2) channel models extracted from the original streams are provided. The cable data sequences A and B have 64K complex samples each. The channels chanA and chanB are modelled by 128 complex taps. The data is sampled at twice per symbol and the carrier frequency has been mixed close to 0 Hz. There is some residual FM on the carrier.
See below for received signal and power spectral density plots. The pictures were generated using the following Matlab commands:
load data1

% Plot rcvd signal
figure(1)
plot(data,'.');

% Plot PSD of signal
figure(2)
[Paa,F]=psd(data);
semilogy(F*1700,fftshift(Paa));
ylabel('Power Spectrum Magnitude (dB)');
xlabel('Frequency');


